S
C
saulcross.com

UI Input Data

Dynamic Graphs & UI design

A: Either using the mouse or a touch screen device, select the bar-graph value by adjusting the height of the tool tip proivded.

B: Once all four input values have been entered, then selecte "Assess Output Total".

C: To view the data as a responsive bar-graph click "View the results as a bar graph", and you web page will be updated.

Due to resources this page has only been tested fully on windows 7, all browsers. I've completed a basic assessment for tablets and Mackintosh. Although the UI works on smaller screen sizes, the interface is more relevant for tablets and desktops.
RWD development ongoing..

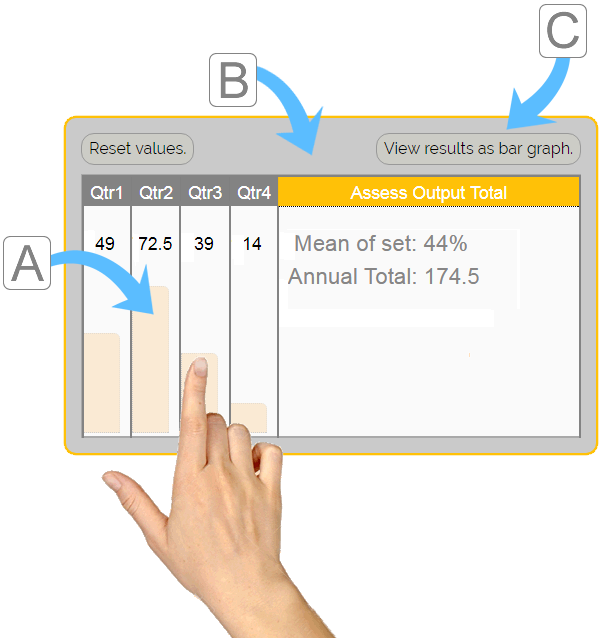
Data items 1 - 42017/18

0 10 20 30 40 50 60 70 80 90
Show | Hide
Reset values. View results as bar graph.
1 2 3 4 >> Assess Output <<
  --   --   --   --